The Facility, Energy and Environmental Management Platform
Measure, manage and optimize facility, energy and environmental efforts all in one data-agnostic platform — a centralized touchstone for sustainability, financial performance, equipment performance, and IPMVP measurement & verification. Because you can’t manage what you don’t measure.
Start Streamlining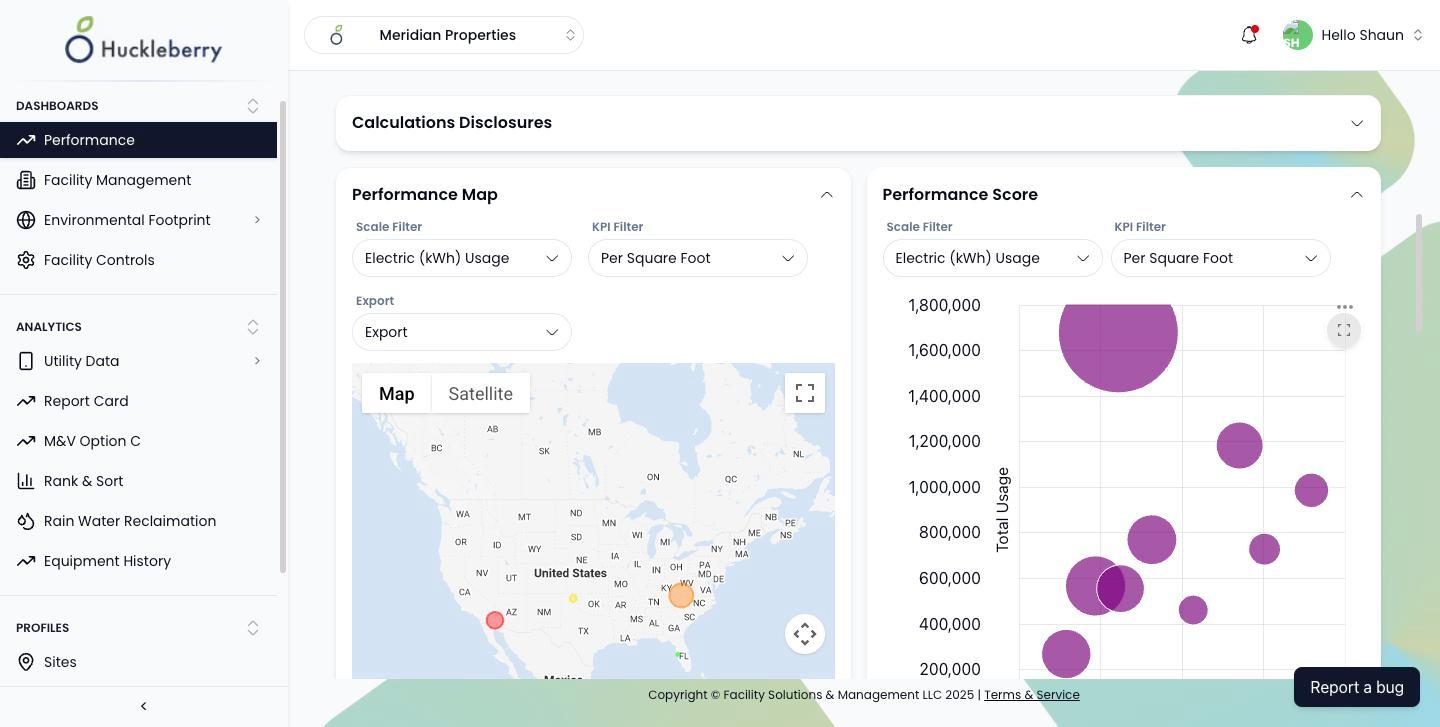
Why Huckleberry
A centralized touchstone for your whole organization
Measure, manage, and optimize — you can’t manage what you don’t measure. Huckleberry is the technological host for your facility and environmental initiatives, strategic and tactical.
Environmental & Sustainability
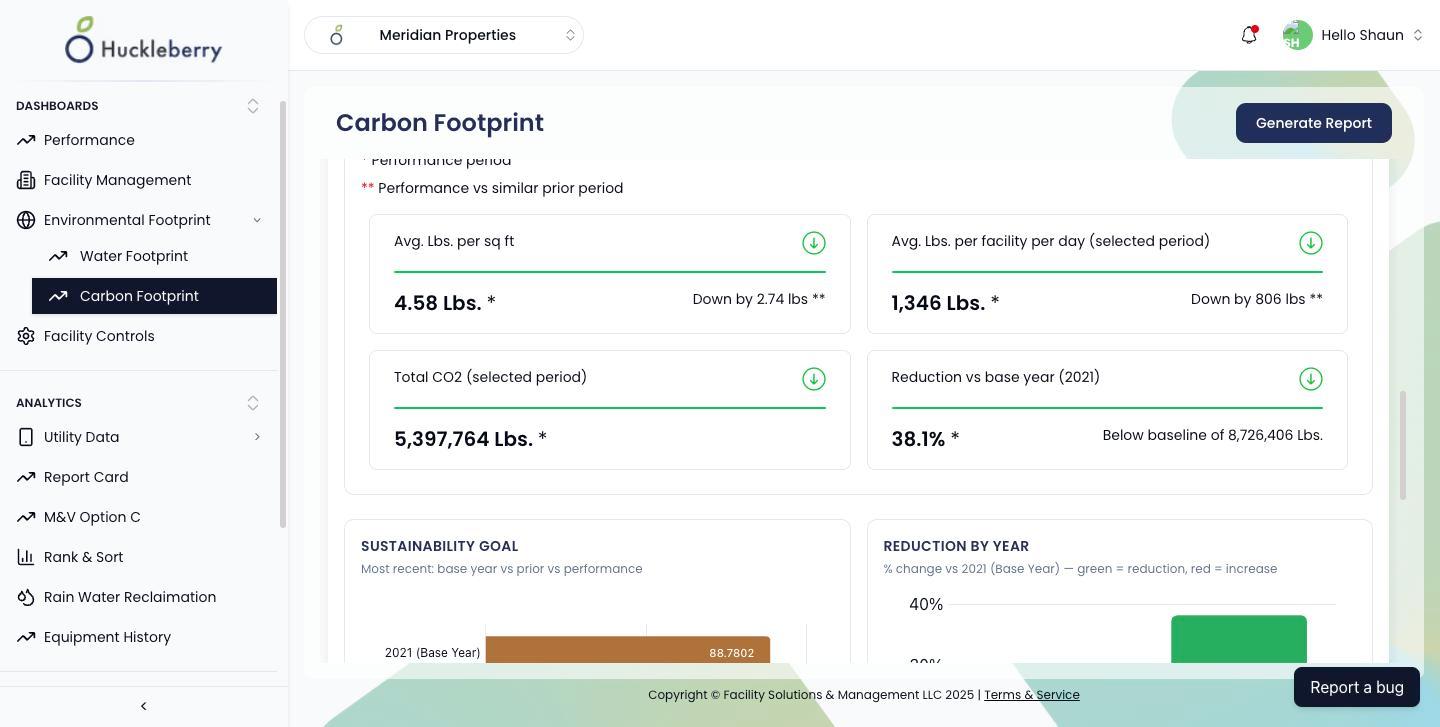
Carbon and water performance tracked against a configurable baseline year, with audit-ready reports for ESG disclosure.
Financial Performance
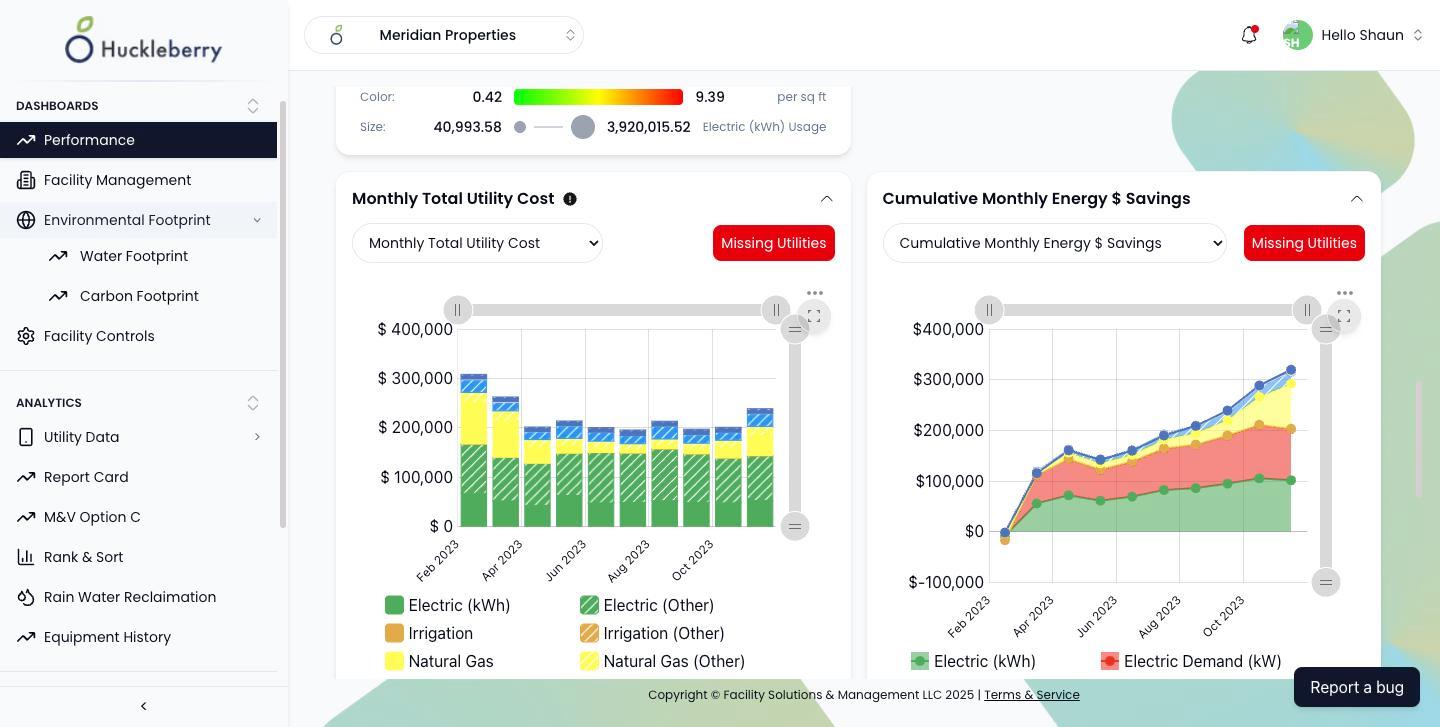
Cost analysis, budget versus actual, and verified savings — every utility dollar traced back to the invoice it came from.
Empowerment & Outreach
Visualization, awareness, and competition modules that turn energy performance into something occupants and customers can see.
Facility & Equipment Performance
Fault detection analytics and cross-portfolio benchmarking — like having virtual engineers monitoring your equipment at all times.
Data Management
One static data layer for facility, equipment, and billing profiles — so every dashboard and report draws on the same source of truth.
IPMVP Measurement & Verification
Whole-facility Option-C savings verification, weather-normalized and auditable month by month.
Platform Features
Everything you need to measure, manage, and optimize facilities, energy, and environmental compliance.
Technology
- Data-Agnostic Architecture
- Cloud-based
- Major SSO Support
- Integrates with Any BMS over a Flexible, Secure Connection
Financial
- IPMVP Option-C Measurement & Verification
- Utility Cost Baseline Comparison Reports
- Automated Weather, Milestone and Custom Normalization
- Automated Invoice Collection with Bill-Image Audit Trail
Environmental
- Carbon (CO₂ tons) and Water (kGallons) Tracking vs. Baseline Year
- ESG and Sustainability Reporting
- Top Efficiency and Reduction Performer Rankings
- Occupant Engagement and Energy Competition Modules
Facility Management
- Real-Time Electric, Water and Solar Meter Readings
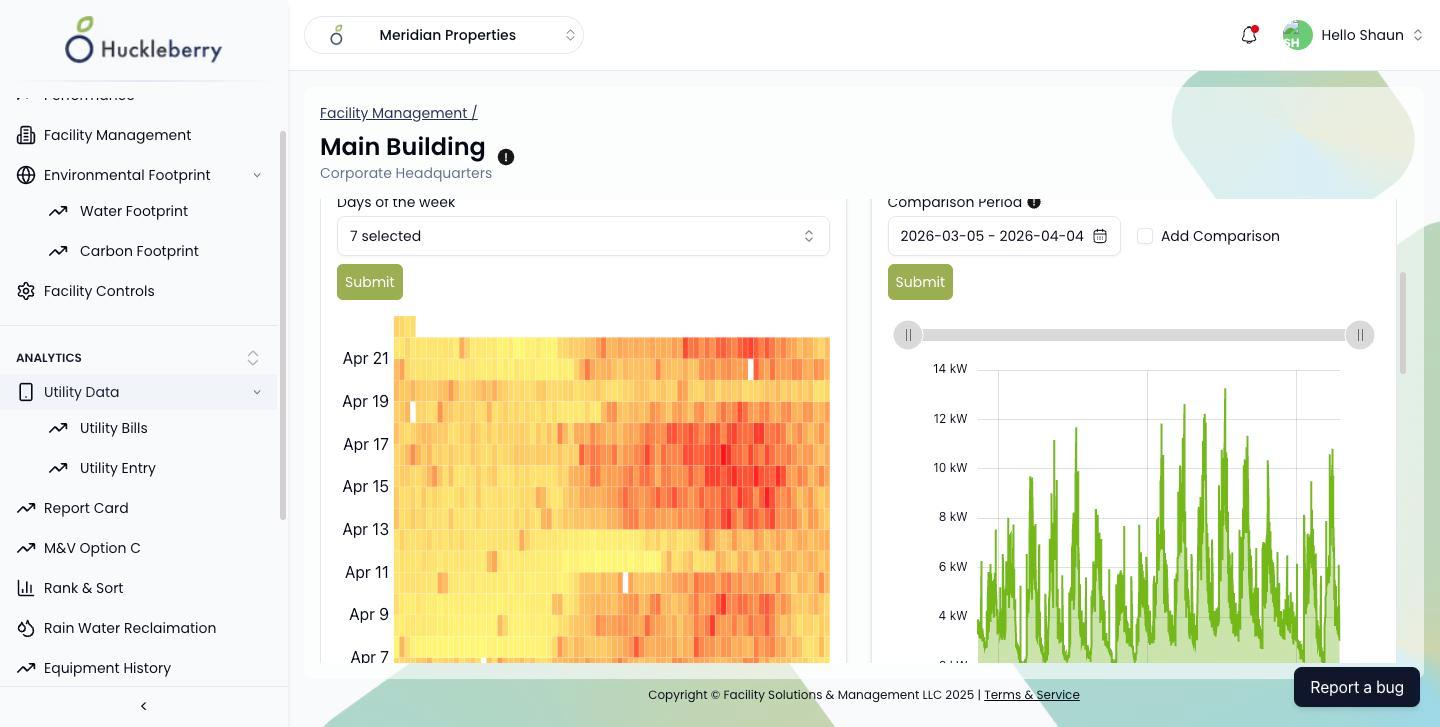
- Consumption Heat Maps by Day and Hour
- Demand and Consumption Spike Alerts, Ranked by Cost Impact
- Equipment Profiles with Maintenance and Multi-Sensor History
Modules
Comprehensive features and benefits
The full Huckleberry experience caters to every audience in your organization: executive, accounting, sustainability, facilities, and employees.
Dashboards
Big-picture perspective for each user group
Performance Dashboard
Long-term goals with period-over-period cost, carbon, and water comparisons — weather and milestone normalized — plus portfolio performance maps.
Facility Management
Live meter readings, real-time demand monitoring, consumption heat maps by day and hour, and alerts on demand and consumption spikes ranked by cost impact. Requires Huckleberry Controls, our live BMS integration.
Environmental Footprint
Carbon and water trends since your baseline year, top efficiency and reduction performers, and ESG-ready audit reports.
Rank & Sort
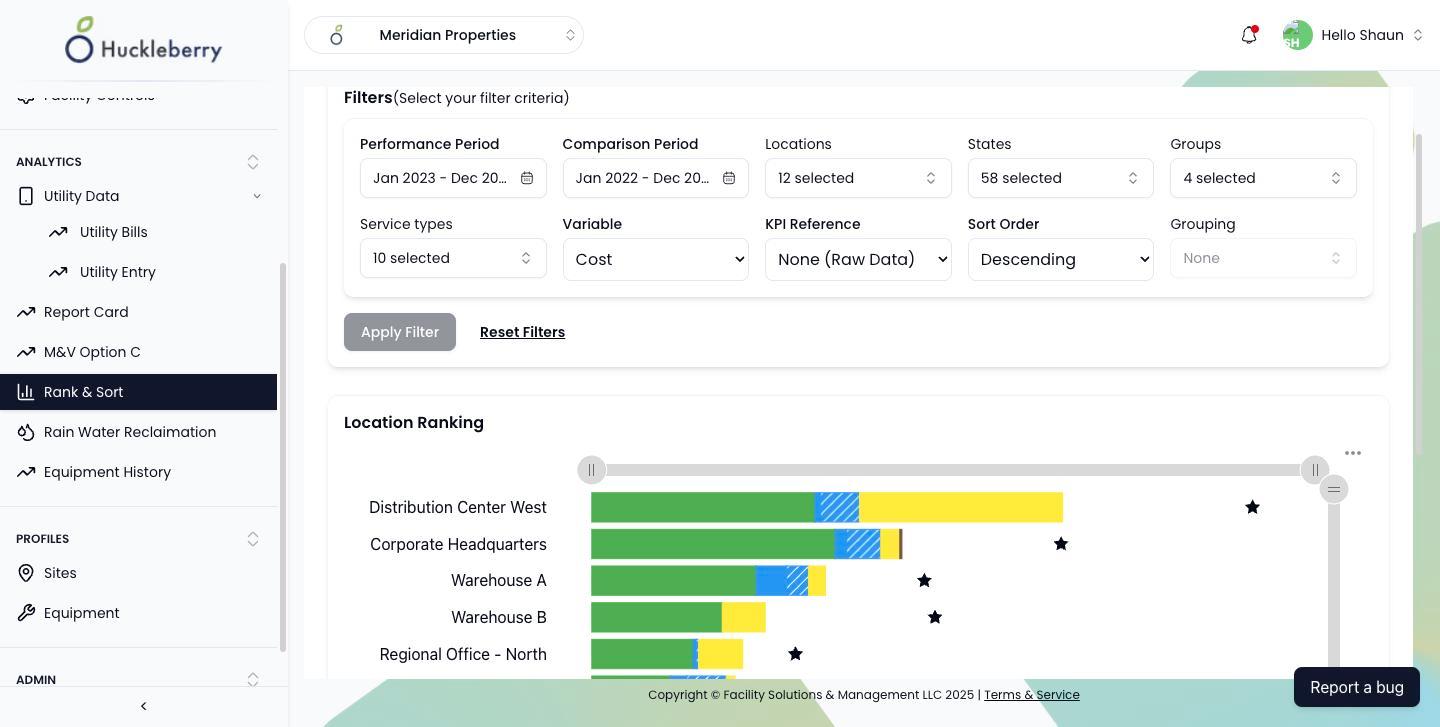
Side-by-side rankings by Cost, Usage, Demand, or any custom KPI, with service-type breakdowns and KPI normalization.
Analytics
Drill-down analysis of issues, opportunities, savings
Utility Billing
Auto-collected invoices with a full audit trail — filter by date, location, or service, open the original bill image, and export custom-column CSVs.
Measurement & Verification
Two modules: the IPMVP Option-C savings engine, plus a separate auto-generated Report Card.
Sub Systems
Custom integrations for anything you need in one place — BMS graphics, rainwater reclamation, solar production, greywater, and more.
Profiles & Admin
Static data layer plus onboarding and governance
Equipment Profile
A master record per asset — HVAC, plumbing, electrical, and more — with maintenance logs, multi-sensor time-series history, and bulk import.
Live Equipment Data
Real-time BMS sensor readings, thermostat setpoints, and on/off states for cooling, heating, fan, and bypass — auto-refreshed every few minutes. Requires Huckleberry Controls, our live BMS integration.
Site Profiles
Property metadata, ENERGY STAR-aligned audit fields, and custom business KPIs such as headcount, sales, or beds.
Account Management
Self-service onboarding for utility accounts, sites, users, roles, and KPI definitions — with credential health surfaced as issues appear.
Requires Huckleberry Controls (live BMS integration).
Analytics
Measurement & Verification
Two distinct modules under M&V — built independently, used together.
What is IPMVP?
International Performance Measurement & Verification Protocol
The industry-standard framework for verifying energy and water savings from efficiency projects. Used by ESCOs, utilities, and sustainability auditors worldwide.
IPMVP Option-C
Whole-facility regression-based savings verification engine
- Whole-facility baseline regression model
- Actual vs. predicted savings, weather-normalized
- Cumulative savings over time
- Custom-variable models (occupancy, production, etc.)
- Auditable monthly breakdown table
Report Card
Auto-generated monthly facility performance summary
- Independent module — separate workflow from IPMVP
- One-click “Generate Report Card” per period
- Savings achieved across all utility types in a single table
- Monthly delivery via scheduled email
- Downloadable PDF for stakeholder distribution
Huckleberry scope
- Option C — Whole-Facility (regression-based baseline) supported
- Options A, B, and D not currently offered
Deliverables
Reports & Exports
Audit-ready outputs for stakeholders, auditors, and compliance reviews.
Performance Report Card
Monthly facility-level savings summary, delivered as a PDF on a scheduled email.
IPMVP Option-C Report
Whole-facility regression-modeled savings verification.
Carbon Footprint Report
CO₂ tons by location and period, with KPI normalization.
Water Footprint Report
kGallons by location and period, with KPI normalization.
Utility Bill Exports
CSV and table exports of every bill, using custom column sets.
Let’s Talk
Ready to streamline your facility management? Get in touch.