Equipment Profiles and Asset Management
The question “when did this unit last get touched, and has it been drifting since?” is usually answered by asking whoever has been there longest. Equipment Profiles put it in the system instead.
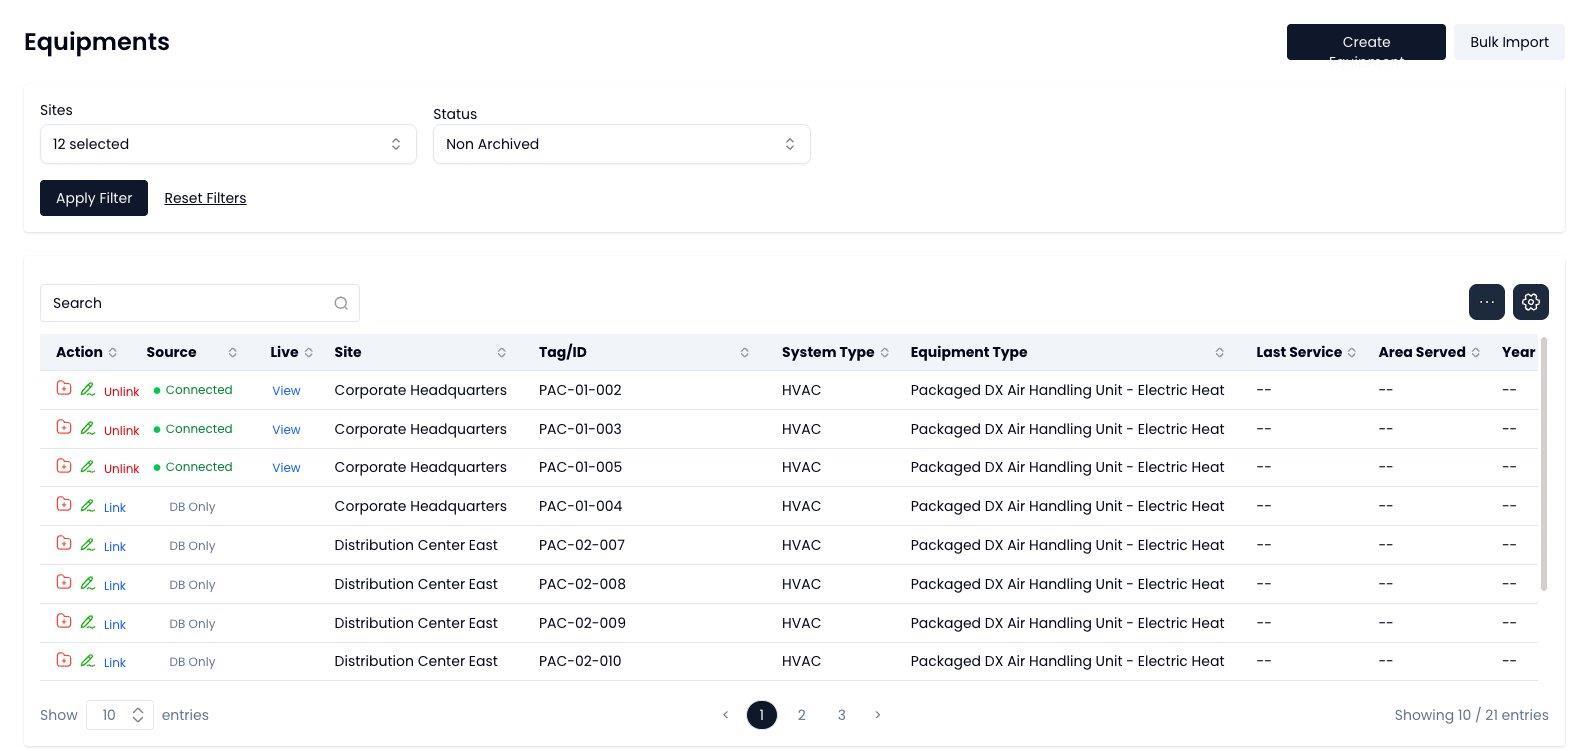
One record per asset
Every piece of equipment — HVAC, plumbing, electrical, and anything else you choose to track — gets a master record holding what it is, where it is, and what has happened to it. Assets belong to sites and buildings, so the hierarchy matches how the portfolio is actually organized.
Existing asset registers can be brought in through bulk import rather than re-entered, which is usually what determines whether a system like this gets adopted or abandoned.
Maintenance history that stays with the asset
Maintenance events are logged against the equipment record, so the history travels with the asset rather than living in a technician’s notes or a separate work-order system nobody cross-references.
The practical payoff arrives when performance degrades. Being able to see that a unit was serviced three weeks before a consumption change is the difference between diagnosing a problem and guessing at one.
Multi-sensor time-series history
Where equipment is instrumented, its sensor history is kept alongside the record — multiple sensors per asset, over time. Setpoints, temperatures, states, and run times can be reviewed together instead of one trend at a time.
That combination is what makes fault patterns legible. Simultaneous heating and cooling, short cycling, or a unit that never reaches setpoint are all visible in the relationship between sensors, not in any single one.
The link to live data
Equipment Profiles work with utility data alone as an asset register and maintenance history. Sites with Huckleberry Controls additionally get live sensor readings flowing into the same records, which is where the time-series history comes from.
Who it’s for
- Maintenance teams
- One place to record what was done, on what, and when — that other people can actually find.
- Facility engineers
- Correlate equipment behavior with consumption instead of treating them as separate systems.
- Capital planning
- Service history and performance drift, per asset, when replacement decisions come up.
Related modules
- Live Equipment DataIntegrate any BMS — including the Honeywell, Lynxspring, and Schneider Electric Niagara lines — over a secure connection that fits the site.
- Facility ManagementLive meter readings, real-time demand monitoring, consumption heat maps by day and hour, and spike alerts ranked by what they actually cost you.
- Site ProfilesProperty metadata, ENERGY STAR-aligned audit fields, and custom business KPIs such as headcount, sales, or beds — the static layer the analytics normalize against.
See it against your own sites
The fastest way to judge this is to point it at a handful of your buildings and see what comes back.
Request a demo