Site Profiles and Building Data
Every normalized number in the platform depends on knowing something about the building: how big it is, what it does, how many people are in it. Site Profiles is where that lives, and it is quietly the thing that makes the rest of the analytics honest.
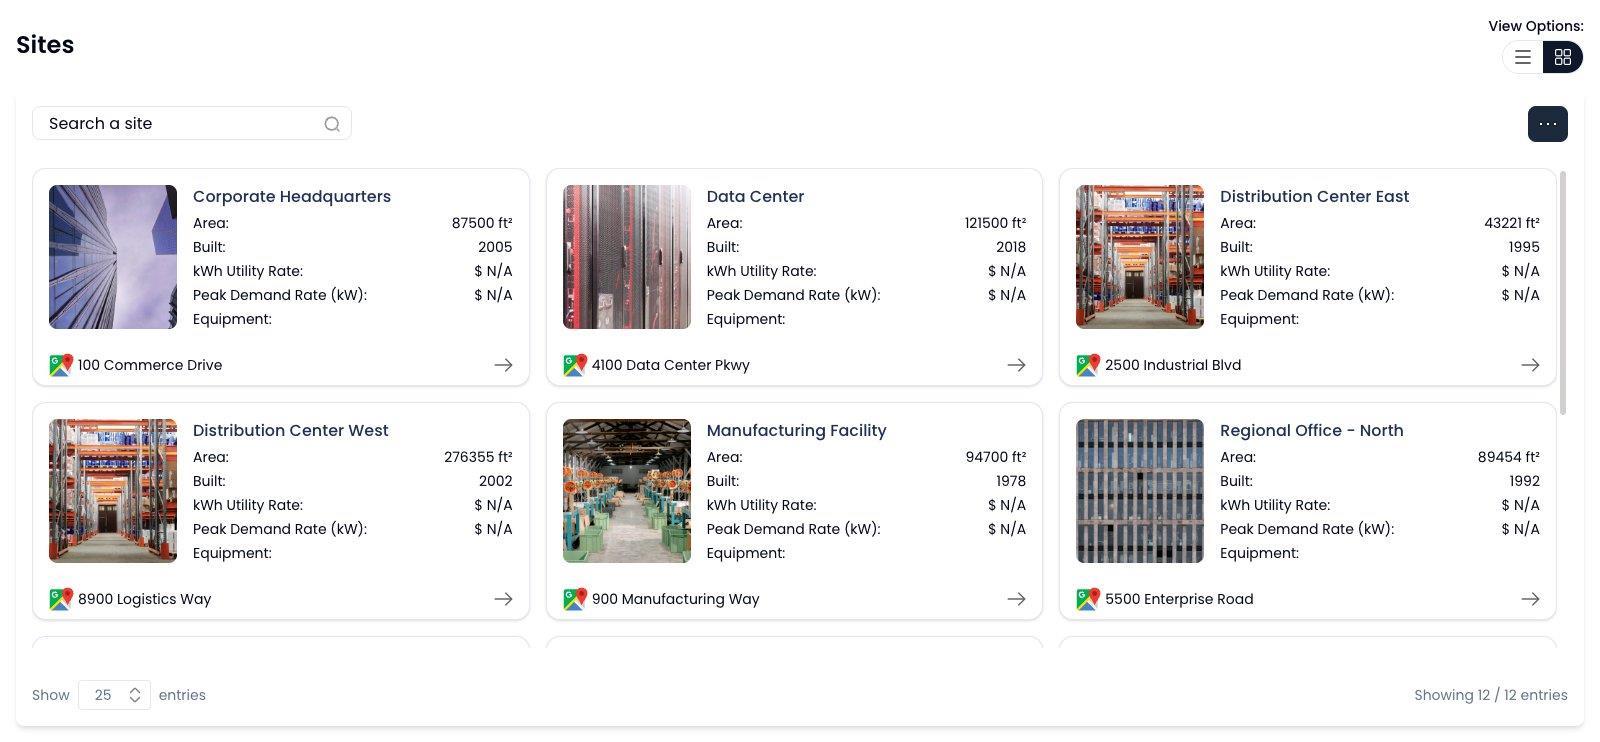
The static layer under the analytics
Square footage, property type, location, and operating characteristics are recorded per site. That metadata is what turns raw consumption into intensity, and intensity is what makes two different buildings comparable at all.
Get this layer wrong and every ranking, benchmark, and per-square-foot figure downstream inherits the error — which is why it is worth treating as data to maintain rather than a form to fill in once.
ENERGY STAR-aligned audit fields
Profile fields are aligned to the property attributes ENERGY STAR asks for, so the information you gather here is the information those programs expect rather than a parallel set that has to be re-collected.
Custom business KPIs
Beyond physical attributes, sites carry custom business KPIs — headcount, sales, beds, units produced, or whatever your organization actually manages by. These become available as normalizing variables throughout the platform.
This is what lets a hospital normalize by beds, a retailer by sales, and a manufacturer by output, instead of all three being handed energy per square foot and told to make it work.
Feeding the models
Custom variables recorded here can serve as independent variables in IPMVP Option-C regression models, for buildings where weather alone does not explain the load. A facility whose consumption tracks production volume needs production volume in the model, and this is where it comes from.
Who it’s for
- Energy managers
- Define the denominators your organization actually reports on, once.
- Sustainability teams
- Property data in the shape ENERGY STAR and disclosure frameworks expect.
- Portfolio managers
- Keep building metadata current so every benchmark downstream stays trustworthy.
Related modules
- Rank & SortRank every site side by side on cost, usage, demand, or any custom KPI, with service-type breakdowns and normalization that makes the comparison fair.
- Environmental FootprintCarbon and water tracked against your baseline year, normalized by the KPIs your organization reports on, and exportable as audit-ready ESG reports.
- Account ManagementSelf-service onboarding for utility accounts, sites, users, roles, and KPI definitions — with utility credential health surfaced as issues appear.
See it against your own sites
The fastest way to judge this is to point it at a handful of your buildings and see what comes back.
Request a demo