Real-Time Facility and Energy Monitoring
A monthly utility bill tells you what happened four to six weeks ago. By the time a demand spike shows up as a charge, the money is gone and nobody remembers what the building was doing that afternoon. Live monitoring closes that gap.
Requires Huckleberry Controls — a live BMS integration
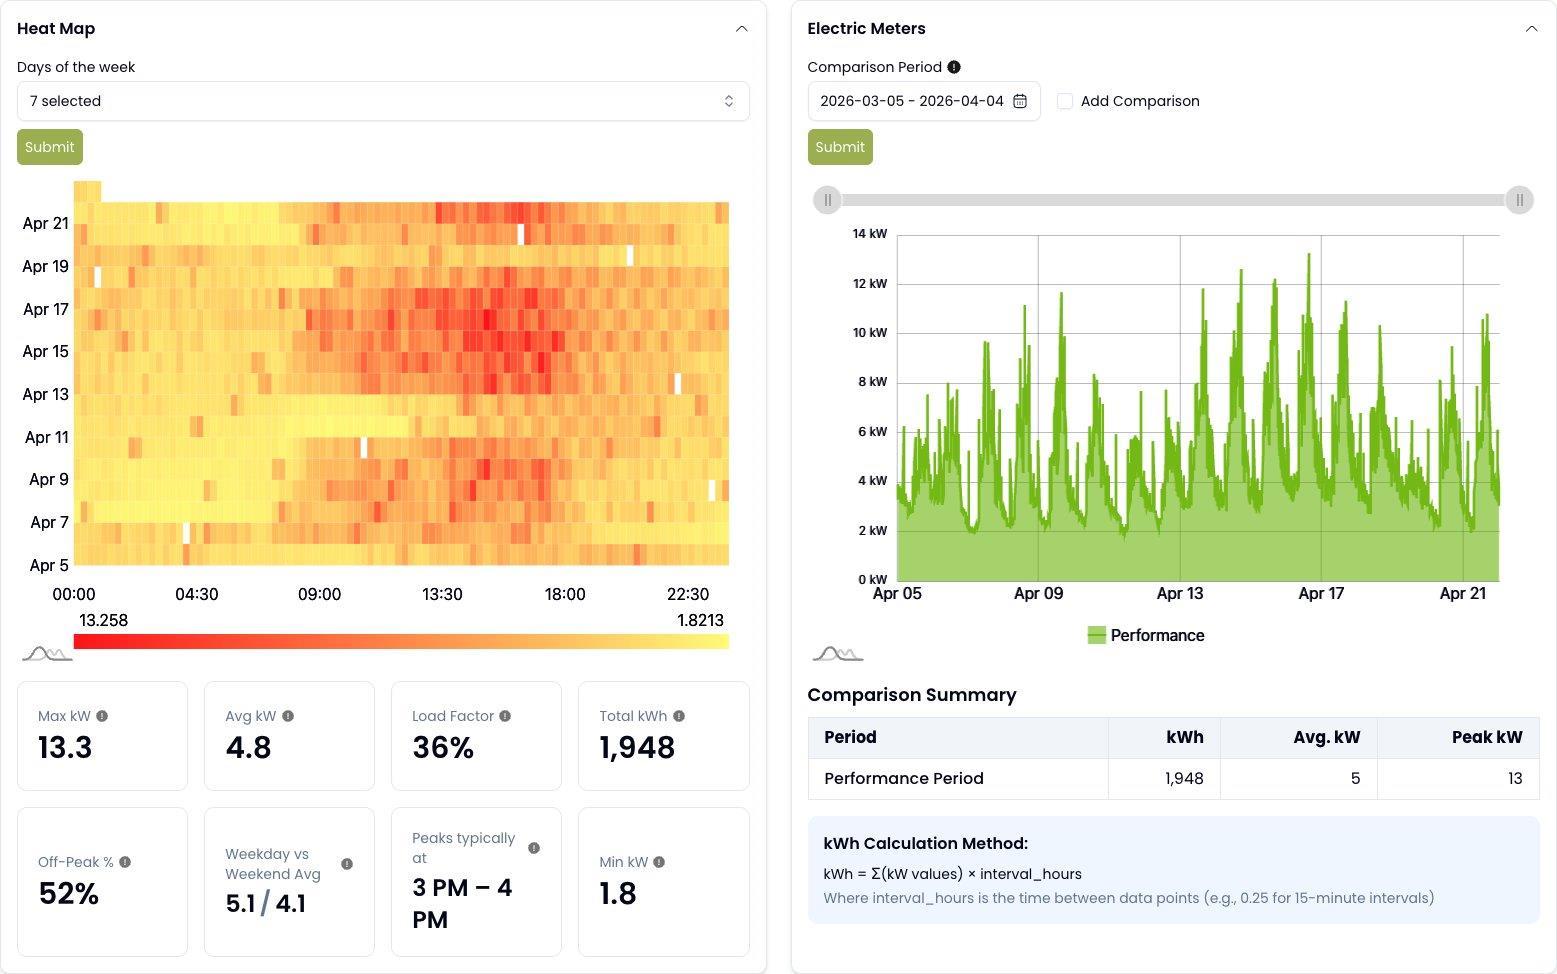
Meter readings as they happen
Electric, water, and solar meters report continuously rather than monthly. Current demand, current consumption, and the shape of the day are visible while you can still do something about them.
This is where the distinction between utility data and live data matters. Billed usage tells you the total; live readings tell you when, and when is what you act on.
Heat maps by day and hour
Consumption plotted across days and hours makes patterns obvious that a line chart hides. Equipment running through the night, weekend loads in an empty building, a start-up ramp an hour earlier than the schedule says — these show up as blocks of color, not as anomalies you have to go looking for.
It is usually the fastest way to find scheduling waste, which is also the cheapest waste to eliminate. No capital, just a corrected schedule.
Alerts ranked by cost impact
Demand and consumption spikes raise alerts, and the alerts are ordered by what they cost rather than by when they happened. A team that can act on three things this week should be told which three.
Demand charges in particular are worth catching early: in many tariffs a single fifteen-minute peak sets a charge that persists for months. Knowing about it the same day is a materially different situation from finding it on an invoice.
Requires Huckleberry Controls
Real-time monitoring depends on a live connection to the building, not just its utility accounts. That means a BMS integration — any vendor, over whatever secure path the site allows; for most of our sites that is a Niagara JACE over a secure cellular VPN. Sites with utility data alone still get everything in the billing and reporting modules, but the live view is a Controls capability.
Who it’s for
- Facility and maintenance teams
- See the building as it runs, and catch a fault the same day rather than the next billing cycle.
- Energy managers
- Find scheduling and setpoint waste with heat maps instead of hunting through trend logs.
- Operations leadership
- A ranked list of what is costing money right now, rather than an undifferentiated alert feed.
Related modules
- Live Equipment DataIntegrate any BMS — including the Honeywell, Lynxspring, and Schneider Electric Niagara lines — over a secure connection that fits the site.
- Equipment ProfileA master record for every asset — HVAC, plumbing, electrical and more — with maintenance logs, multi-sensor time-series history, and bulk import.
- Sub SystemsWe connect to any building management system, over whatever secure path the site allows — plus BMS graphics, reclamation, solar, and any other system you need in one place.
See it against your own sites
The fastest way to judge this is to point it at a handful of your buildings and see what comes back.
Request a demo