Carbon and Water Footprint Reporting
Carbon reporting is common. Water reporting, done with the same rigor and against the same baseline, is not — and for a great many organizations water is where both the risk and the easy reduction actually sit.
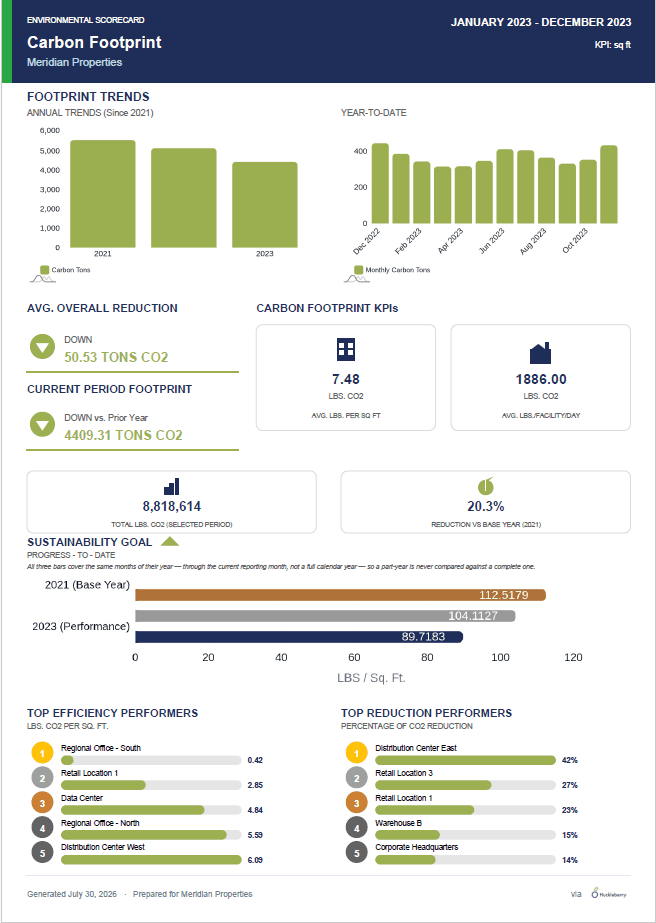
Both footprints, from the same source data
CO₂ in tons and water in thousands of gallons are tracked side by side, built from the utility invoices already collected in the platform. There is no separate data-gathering exercise and no second spreadsheet to reconcile — if the bill is in Huckleberry, it is in the footprint.
Because both come from billed data with the original documents attached, the numbers can be traced back to source when somebody asks how they were derived. That traceability is the difference between a figure you publish and a figure you defend.
Measured against your baseline year
Absolute tonnage is rarely the interesting number. What a board, a disclosure framework, or a customer questionnaire wants is the reduction against a stated starting point, which means the baseline has to be fixed, documented, and consistently applied.
Huckleberry holds that baseline and reports every period against it, with the same weather and milestone normalization used elsewhere in the platform, so growth is not mistaken for backsliding.
Normalized by the KPIs you actually use
Total footprint moves when the organization does. Intensity metrics — per square foot, per bed, per unit produced, per employee — are usually the fairer comparison, and different sectors care about different denominators.
Custom business KPIs defined against your sites can be used as the normalizing variable, so the intensity figure matches how your organization already talks about itself rather than a generic per-square-foot default.
Top performers and problem sites
Rankings surface the sites reducing fastest and the ones moving the wrong way. The first group is where your reduction case study comes from; the second is where next year’s capital should probably go.
Who it’s for
- Sustainability and ESG teams
- Reportable carbon and water figures against a fixed baseline, with the source documents behind them.
- Compliance and reporting
- Export the period, the sites, and the normalization used, so a reviewer can reproduce the number.
- Executive leadership
- Know where the reduction is genuinely coming from, and where the commitment is at risk.
Related modules
- Performance DashboardTrack cost, carbon, and water against your baseline year across every site, weather-normalized, with portfolio performance mapped at a glance.
- Utility BillingCollect every utility invoice automatically, keep the original bill image as an audit trail, and turn cost and usage into reportable data across your portfolio.
- Rank & SortRank every site side by side on cost, usage, demand, or any custom KPI, with service-type breakdowns and normalization that makes the comparison fair.
See it against your own sites
The fastest way to judge this is to point it at a handful of your buildings and see what comes back.
Request a demo