Multi-Site Energy Benchmarking
With more than a handful of buildings, the useful question stops being “how is this site doing?” and becomes “which of these sites deserves my attention this quarter?” Ranking answers it directly.
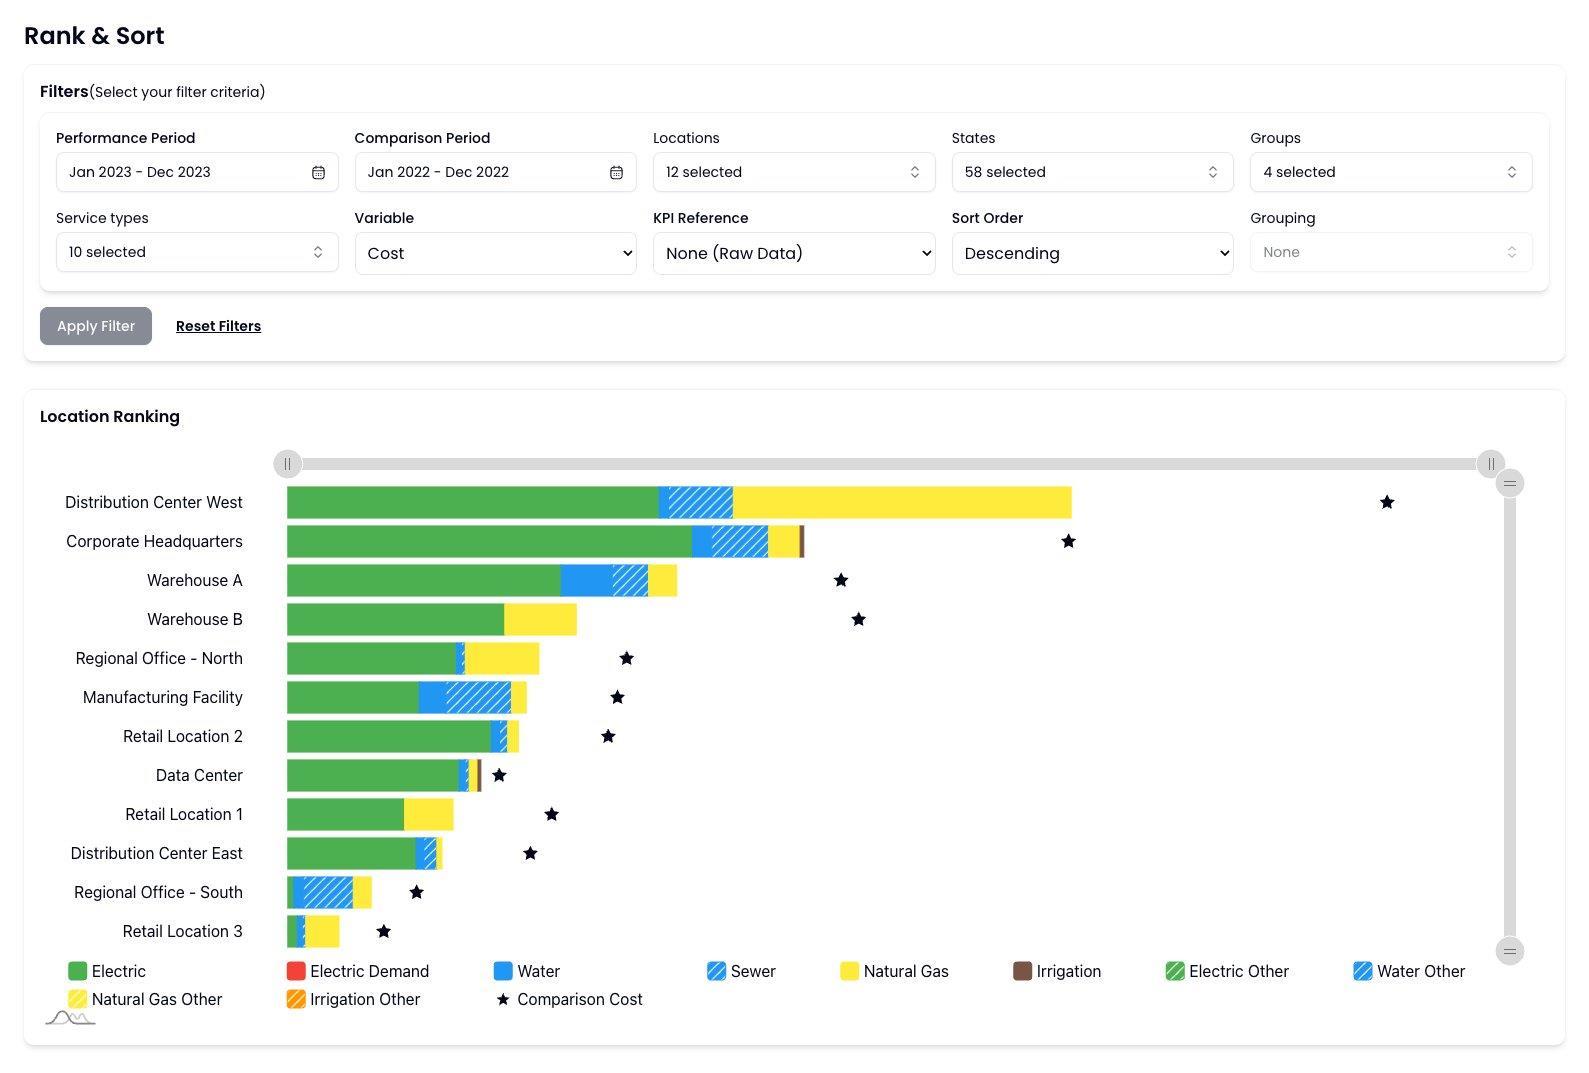
Rank on the measure that matters
Sites can be ordered by cost, usage, demand, or any custom KPI you have defined. Each of those produces a different list, and the differences are informative: a site that is expensive but not high-usage has a rate problem, not an efficiency problem.
Sorting on demand rather than consumption surfaces a third group again — buildings whose peaks are driving charges out of proportion to how much energy they actually use.
Normalized so the comparison is honest
A 200,000 square foot distribution center will always out-consume a branch office, and ranking them raw tells you nothing. Normalization by square footage, headcount, beds, production, or any other KPI defined against your sites turns the list into something actionable.
This is where portfolios usually discover that their worst performer is not their biggest building. It is a mid-sized site everybody had stopped looking at.
Broken out by service type
Electric, gas, water, and every other billed service can be separated, so a ranking reflects the utility you are actually trying to reduce. A site can be excellent on electricity and dreadful on water, and a combined figure hides both facts.
From ranking to action
Rankings are most useful as a triage step. The sites at the wrong end become the candidates for an audit, a controls upgrade, or a rate review — and once work is done, the same ranking is the evidence that it moved.
Who it’s for
- Portfolio and regional managers
- A defensible shortlist of which sites to spend time and capital on this quarter.
- Energy consultants and ESCOs
- Identify the buildings where a project will actually pay back, before proposing one.
- Finance
- Compare cost per normalized unit across the estate rather than raw spend.
Related modules
- Performance DashboardTrack cost, carbon, and water against your baseline year across every site, weather-normalized, with portfolio performance mapped at a glance.
- Utility BillingCollect every utility invoice automatically, keep the original bill image as an audit trail, and turn cost and usage into reportable data across your portfolio.
- Site ProfilesProperty metadata, ENERGY STAR-aligned audit fields, and custom business KPIs such as headcount, sales, or beds — the static layer the analytics normalize against.
See it against your own sites
The fastest way to judge this is to point it at a handful of your buildings and see what comes back.
Request a demo