Utility Bill Management Software
Utility bills are the most complete record of what a building actually costs to run — and the hardest data in the business to get hold of. Huckleberry collects every invoice across every provider, keeps the original bill image attached, and turns cost and usage into something you can report, benchmark, and verify savings against.
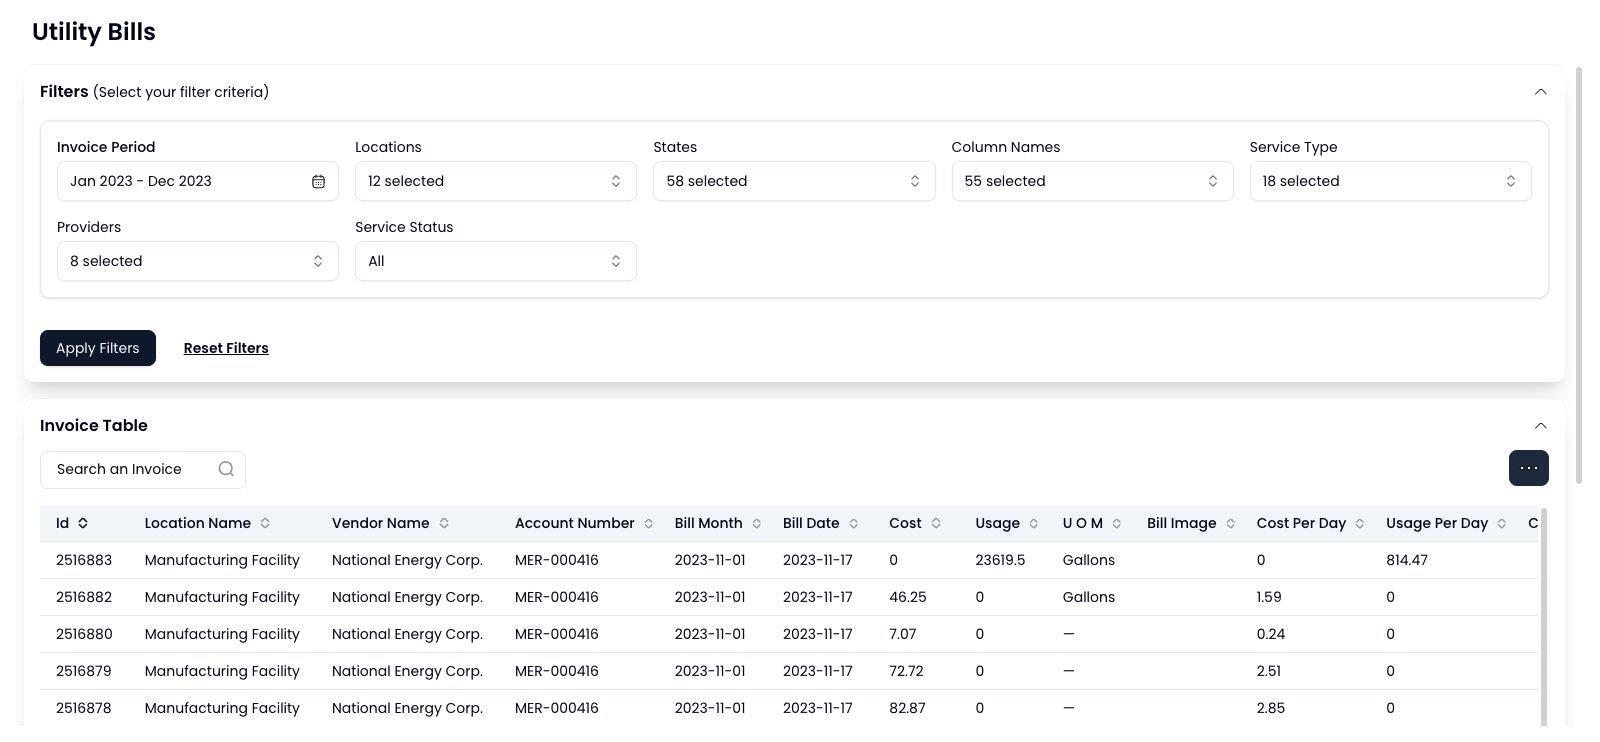
Invoices collected automatically, not chased
Connect a utility account once and Huckleberry retrieves each new invoice as the provider issues it — electric, gas, water, sewer, waste, and anything else you are billed for. There is no monthly download ritual and no shared inbox of PDF attachments to sort through.
Utility credentials expire, providers change portals, and accounts get closed and reopened. When a connection stops working, Huckleberry surfaces it as an issue rather than quietly returning fewer bills, so a gap in the data is something you are told about instead of something you discover a quarter later. Utilities that cannot be collected automatically can be uploaded manually and live alongside everything else.
The original bill, one click away
Every invoice keeps its source document attached. When a number looks wrong — a spike, an unexpected demand charge, a rate change nobody mentioned — you can open the bill image the utility actually issued and check it, rather than arguing from a spreadsheet that has been through three transformations.
That audit trail matters well beyond curiosity. Utility rebate programs, ESG disclosures, and IPMVP savings claims all need billed data that can be traced back to source. Keeping the document with the record is what makes the reporting defensible.
Filter the portfolio, not one account at a time
Invoices are queryable across the whole estate at once: by billing period, by location or state, by service type, by provider. A hundred-site portfolio becomes one table you can narrow rather than a hundred utility logins.
Each row carries the account number, bill month, cost, usage, and cost per day, so uneven billing periods compare honestly — a 33-day month is not mistaken for a spike.
Exports that match how you actually report
Choose the columns you need and export to CSV. Accounting wants account numbers and totals; a sustainability report wants usage by service type; a board deck wants cost per site per month. Rather than one fixed export that everybody reshapes by hand, the export is built to the shape you asked for.
Where the data goes next
Utility billing is not a silo in Huckleberry — it is the foundation the rest of the platform is built on. The same invoices feed weather-normalized baseline comparisons, carbon and water footprint reporting, portfolio rankings, and the IPMVP Option-C engine that verifies savings from efficiency work.
That is the practical argument for collecting bills properly: the quality of every downstream number depends on it. Savings you cannot evidence are savings you cannot claim.
Who it’s for
- Accounting and AP
- Stop keying invoices by hand and stop chasing utility portals for a copy of last month’s bill. Every invoice arrives with its cost, usage, and service type already structured.
- Energy and sustainability managers
- Billed usage is the input for carbon and water reporting, baseline comparisons, and savings verification. Getting it complete and on time is the whole job.
- Facility and operations leaders
- See which sites are drifting on cost per day before the quarter closes, rather than reconstructing it afterwards from spreadsheets.
Related modules
- Tenant RebillingRecover utility costs from commercial tenants with effective-dated bill % rules, GL-coded accounting workbooks, and branded per-tenant statements.
- Measurement & VerificationWhole-facility regression-based savings verification to IPMVP Option-C, weather-normalized, with an auditable monthly breakdown and a scheduled Report Card.
- Environmental FootprintCarbon and water tracked against your baseline year, normalized by the KPIs your organization reports on, and exportable as audit-ready ESG reports.
See it against your own sites
The fastest way to judge this is to point it at a handful of your buildings and see what comes back.
Request a demo