IPMVP Option-C Measurement and Verification
Claiming savings is easy. Proving them to somebody who has a reason to doubt you is the hard part, and it is what IPMVP exists for. Huckleberry implements Option-C — whole-facility, regression-based verification — as a working engine rather than a spreadsheet exercise.
What IPMVP Option-C actually requires
The International Performance Measurement and Verification Protocol is the industry-standard framework for verifying energy and water savings from efficiency projects, used by ESCOs, utilities, and sustainability auditors worldwide. It defines several options; Option-C is the whole-facility approach.
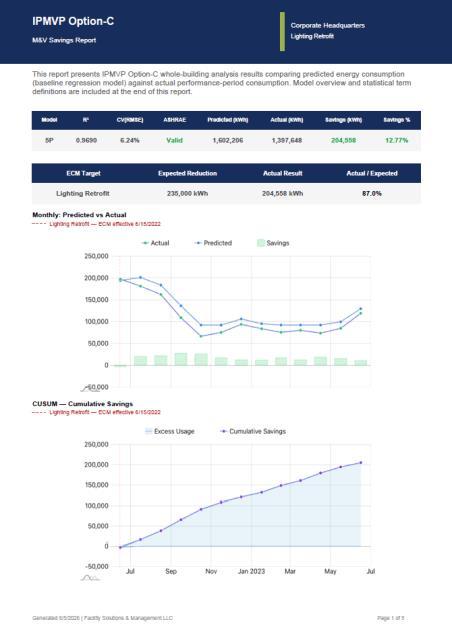
Option-C works by building a regression model of the building’s baseline consumption against the variables that actually drive it — typically weather, sometimes occupancy or production. After a project, the model predicts what the building would have consumed under the conditions that actually occurred, and savings are the difference between that prediction and the metered reality. Done properly, it survives scrutiny in a way that “we used less than last year” never does.
The engine, not the spreadsheet
Huckleberry builds and holds the baseline regression model per facility, then reports actual against predicted for each period, weather-normalized, with cumulative savings tracked over time. Models can use custom independent variables — occupancy, production volume, and other business measures — where weather alone does not explain the load.
Each period is backed by an auditable monthly breakdown table, so a reviewer can see the inputs, the prediction, and the resulting savings rather than a single headline figure. That table is usually what a third-party verifier asks for first.
Scope: Option-C only, deliberately
Huckleberry supports Option C, whole-facility regression-based verification. Options A, B, and D — retrofit isolation with key or all parameters measured, and calibrated simulation — are not currently offered.
This is a deliberate scope rather than a gap. Option-C fits the situation most portfolios are actually in: whole-building utility data, multiple overlapping measures, and no appetite for sub-metering every retrofit individually.
The Report Card, a separate module
Alongside the IPMVP engine sits an independently built module: an auto-generated monthly Performance Report Card. It summarizes savings achieved across every utility type in a single table, with month-over-month and cumulative context.
It runs on its own workflow — generated per period, delivered by scheduled email, and downloadable as a PDF for distribution to stakeholders who are never going to log in. The two modules are built separately and used together: the IPMVP engine is the rigorous verification, the Report Card is the thing that lands in an inbox every month.
Who it’s for
- ESCOs and performance contractors
- Verification your customer’s finance team will accept, with the monthly breakdown behind every number.
- Energy managers
- Evidence that a project delivered, separated from the weather and from everything else that changed.
- Finance and audit
- A documented method, a fixed baseline model, and a table that reconstructs the claim.
Related modules
- Utility BillingCollect every utility invoice automatically, keep the original bill image as an audit trail, and turn cost and usage into reportable data across your portfolio.
- Performance DashboardTrack cost, carbon, and water against your baseline year across every site, weather-normalized, with portfolio performance mapped at a glance.
- Environmental FootprintCarbon and water tracked against your baseline year, normalized by the KPIs your organization reports on, and exportable as audit-ready ESG reports.
See it against your own sites
The fastest way to judge this is to point it at a handful of your buildings and see what comes back.
Request a demo